— Seven Guidelines for Clearer Scientific Writing —
It is no secret that I think scientific writing in general could be clearer. Occasionally scientists can be wilfully obscure, choosing long words or elaborate explanations where much simpler alternatives exist, but often clarity is lacking because of perfectly innocent stylistic mistakes which inadvertently make life for the reader a bit harder than it needs to be. The following guidelines tackle some of the most common problems in this category which I have observed. I hesitate to call them rules, because there are plenty of individual cases in which it might be suitable not to follow one or other of them, but they should provide food for thought. Feedback is welcome.
Know what to leave out. A longer paper is not necessarily a better one, and including less relevant material distracts readers and dilutes the impact of your message. It may have taken you weeks or even months to understand a piece of theory or master an experimental technique, but if your target audience will already be fully familiar with it then a detailed account of your efforts will just pad out the manuscript unnecessarily, frustrating experienced readers. (Note, though, that maintaining focus on your message is not the same as the ethically questionable practice of selectively reporting results.)
Carefully consider the clearest method for presenting each result. Paragraphs full of numbers such as statistical P-values can be extremely hard to make sense of, and this kind of data is usually better presented in a table or graph. Consider this example, which is one sentence from a paragraph which follows this style throughout.
Activity in the faster, slower, and same rate conditions was significantly lower than in the same rhythm condition (faster vs. same rhythm: t23 = 2.24, P = 0.035; slower vs. same rhythm: t23 = 3.23, P = 0.004; same rate vs. same rhythm: t23 = 2.36, P = 0.027).
There’s nothing truly wrong here, and the information is all relevant, but the key message of the sentence is contained entirely in the unbracketed first part. The remainder of the sentence simply provides statistical evidence to support that message. After reading several sentences like this, the reader is likely to lose sight of the key points amongst the details, and at any rate the t and P values will go in one ear and out the other. It would probably be better to put the figures into a table, to which the reader can refer when needed.
Do not favour prettiness over effectiveness in graphics. This point is closely related to the previous one. It is easy to be seduced by graphical techniques which provide a “wow-factor”, but a graphical figure should appear in a scientific document to illustrate a point, and if that point is not clearly made by the figure in question then it is not doing its job. Consider the elaborate example below.
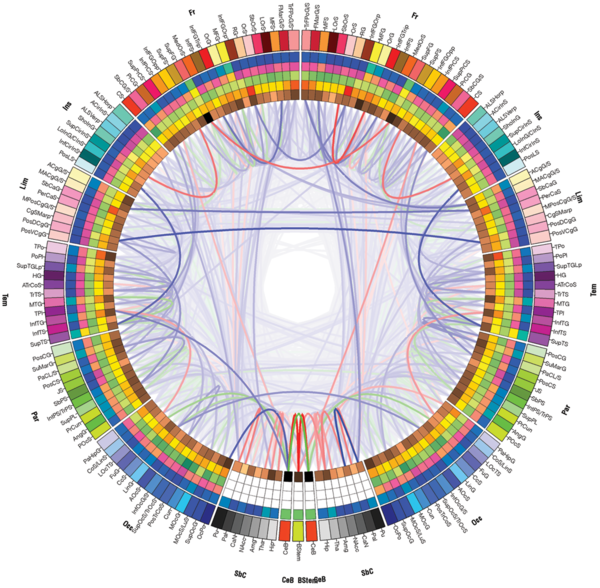
There is so much information crammed in here as to make the diagram overwhelming, and therefore unhelpful. There may be interesting patterns in some of the information represented using various colour scales, but if there is, it is almost impossible to make out.
Do not clutter up the text with words you don’t need. Don’t write in order to where to is sufficient. Don’t define acronyms which you never use again. The abstract of your paper can be treated as distinct from the main text with regard to definitions, so only terms required in the abstract itself need to be defined there.
Use asides—passages separated from the main text using round brackets or em dashes, like this one—only sparingly. Parenthetic material can be very helpful, and the use of brackets for citations is completely standard, but they can get out of hand and end up being a distraction. Use of footnotes may alleviate the problem in some cases, but often it is better to rephrase the text so that the same message can be communicated with fewer shifts of context.
Place citations at the end of the sentence or clause to which they relate, rather than in the middle. This is particularly important if several citations are given together. Compare the two sentences below.
Several studies (Jones et al., 2007; Jones et al., 2008; Smith et al., 2010) have shown that this is the case.
Several studies have shown that this is the case (Jones et al., 2007; Jones et al., 2008; Smith et al., 2010).
Although it may seem more logical to overtly associate the references with the word studies, the effect of breaking up the sentence is to disorient the reader. The longer the list of citations, the more likely it is that your reader will have forgotten the first half of the sentence by the time they reach the second half.
Get others to read your work. That may seem obvious, but often scientific papers are only read before submission by coauthors, who are already quite familiar with the research being described. If at all possible, it is often invaluable to ask a scientist familiar with the general area but not with your experiments in particular to read through it. Lapses in clarity are likely to be far more obvious to them than they would be to the article’s authors. Getting a professional proofreader to look it over isn’t a bad idea, either!
Example sources
- J.A. Grahn & J.B. Rowe, Cerebral Cortex 23:913–921.
- J.D. Van Horn et al., PLoS ONE 7:e37454.